
Audiology Marketing
Audiology Marketing Dashboard: How to Know Exactly Which Ads Are Making You Money
Most clinics are flying blind on their digital marketing. Here is what a real reporting dashboard looks like, how attribution actually works, and why the 180 day window changes everything.
“I have no idea.”
That was the answer I got from a clinic owner back in June when I asked how his digital marketing was performing. His provider had given him a login and a single number on a screen. Total spend. Total revenue. That was it.
After nine years in audiology marketing, I know he is not alone. Most clinic owners are flying blind on their marketing spend. Their team pulls data from four or five different systems. They guess at what is working. They miss revenue attributions completely. And when it is time to make a real budget decision, they are relying on gut feel instead of numbers.
Every clinic needs one place where all of its marketing data lives. Ad spend, lead sources, appointments booked, treatments started, revenue earned. No more logging into Meta, then Google, then your CRM, then a Google Sheet, then Analytics. One dashboard. Real attribution. Real answers.
You cannot make good budget decisions when your marketing data lives in five different tools. You need one view, tied to revenue, that tells you the truth about your funnel.
The Reporting Problem Every Clinic Owner Faces
Here is what reporting has looked like at most clinics I have worked with over the years.
You have a Google Sheet. The team logs into it periodically to see how much has been spent on different digital ad campaigns. Then they go through every name on the sheet manually. Did this person book an appointment? Did they start treatment? What was the revenue?
Then there is another sheet with phone numbers, sometimes with names attached, sometimes not. The team has to cross reference those phone numbers in Sycle, Blueprint, or Counselor to figure out who they belong to. Then update the sheet. Then move on to the next one.
It is a huge mess. And it eats hours every week that your team could be spending on patient care or actual follow up. The other option, the single number on a screen, is even worse. You cannot tell which campaign produced what. You cannot see if Meta is outperforming Google. You cannot spot the specific ad that drove last week’s treatment start.
Both options make it nearly impossible to make good budget decisions. That is the reason we built FlowView.
What a Real Dashboard Should Show You
The first thing any clinic dashboard needs to answer is simple. Where is the revenue coming from?
Not just total revenue. Broken out by source. Lead generated revenue versus other sources. Then within lead generated, broken down by Meta ads, Google ads, and organic search. Each with its own spend, appointment count, and treatment starts attributed to it.
That is the top of FlowView when you log in. Total revenue. Total leads. Opportunities (new patients plus update patients coming back to re up their treatment). Treatment starts. All filtered by whichever location you are viewing, over whichever date range you want, from a single week to a custom range spanning any period.
For clinic owners with multiple locations, that filter matters. You can switch between locations to see how each is performing on its own. You can pull a custom date range that matches exactly when a specific campaign was live and see just that window’s numbers. That is the level of visibility that lets you make real decisions instead of guesses.
How Attribution Actually Works: The 180 Day Window
This is where most reporting tools get it wrong. Attribution.
A lead does not always convert the first time they see your ad. They might see a Meta ad in April, do nothing, then Google your clinic in September when their hearing gets worse. Which source gets the credit?
Our rule is simple. If a person became a lead from a lead generation source within the last 180 days, they get attributed back to that original source.
Example one: Someone sees your Instagram ad today. They fill out a Meta lead form but do not book. A full year passes with no activity. Then they Google “hearing aids near me” and click your Google ad.
That gets attributed to Google. The Meta touchpoint was more than 180 days ago, so the system starts fresh with Google as the source of record.
Example two: Someone comes in as a Meta lead three months ago. Your automation sends drip texts. Your phones team follows up. Three months later they opt back in and book.
That gets attributed to Meta. They entered within the 180 day window, so Meta gets credit for the eventual close.
Why does this matter? Because if you are not attributing correctly, you will make bad budget decisions. You will cut the Meta campaign that is actually feeding your automation system months later. Or you will pour more money into Google when the real driver was a Meta ad that seeded the pipeline six weeks ago.
That is the point of proper attribution. It shows you the truth about your funnel, not just the last click.
Meta, Google, and Organic: Splitting the Sources Correctly
Once attribution is set, the dashboard breaks out revenue and leads by source.
Meta covers your paid ads running through Ads Manager. Every opt in from a lead form or landing page gets tagged as a Meta lead the moment it hits the system. Our Meta Ads for audiology clinics page breaks down how those campaigns work.
Google covers paid search ads. These show up as sponsored results at the top of Google when someone searches for hearing related terms. Every click carries a UTM tag that identifies the source, and when a lead opts in through a landing page, they are tagged as Google paid. See our Google Ads for audiology page for the full breakdown.
Organic covers leads that came from Google without a paid click. Someone found you through your map pack listing, your organic search ranking, or your website content. Organic leads do not have a spend attached, because you are not paying per click for them. What you pay for is the work behind them: SEO, content, and technical optimization. That is what our local SEO and AI SEO services handle.
For clinics in the Excellence in Audiology network, there is a fourth section reporting on network listing leads. Those come from Excellence in Audiology, MyTinnitusNumber.org, DefeatDementia.com, and a falls prevention brand launching in the next month or so.
See What FlowView Tracks
Lead sources, campaign return on ad spend, treatment starts, website analytics, and Google Maps rankings in one dashboard.
The Performance Page: Which Ads Are Making You Money
This one might be my favorite page in the whole dashboard.
The performance page breaks everything down by campaign. Every Meta campaign, every Google campaign, with spend and revenue attributed directly to each one.
Here is an example of the kind of insight it surfaces. Say you are running a hearing aid leads campaign. The dashboard shows $14,000 in revenue attributed to that campaign against $864 in spend. If those were your real numbers, you would never stop running that ad. That is the value of campaign level attribution. You stop treating your ad account like a single lump of spend and start seeing which specific creatives, offers, and audiences are producing the revenue.
My team refers to this page constantly. Weekly at minimum. It is the difference between running ads and actually managing them.
Beyond Ads: Website, Maps, and Call Tracking in One Place
Ads are one piece of the picture. The dashboard also pulls in the rest of your digital presence.
Website reporting connects to your Google Analytics data. Page views, engagement rate, average time on page, top performing pages, where your contacts are coming from. Instead of navigating to Analytics and figuring it out, you see it all inside FlowView.
Google Maps rankings show where you are pulling up on the map pack for the terms that matter. We track hearing aids, hearing clinic, tinnitus, and tinnitus treatment as standard keywords. You can see real time how you are ranking in your service area, typically about 10 miles north and 10 miles south of your clinic location. Green means you are in the top three. Yellow is average. Red means you have work to do.
Calls integrate with Patient Prism, CallRail, or our own Treatment Flow system. You can see who called, what numbers they called, when the calls happened, and the full activity trail. This is where a lot of the attribution actually gets confirmed, because phone calls are still where a huge share of audiology appointments get booked.
What Is Coming Next
We are not done building. Here is what is launching in the next month or two.
AI call scoring is the big one. Every incoming call to your tracked numbers gets analyzed by AI. It listens for keywords, identifies whether the call resulted in a scheduled appointment or a lost opportunity, and assigns a letter grade to the call. A through F. Sort by grade, pull transcripts, and use them for phones team training. Our AI Assistant service handles the outbound side of the same problem.
Lead to opportunity to treatment timing shows the average time it takes for a lead to become an opportunity, and for an opportunity to become a treatment start. That kind of timing data lets you set realistic expectations and diagnose bottlenecks.
Trends across month over month, quarter over quarter, year over year. See if you are on pace to hit your goals, and where the drift is happening if you are not.
Benchmarking against comparable clinics in the network. If the average clinic is getting a 5 to 1 return on Meta and you are at 4 to 1, you will know. And more importantly, you will know it is not just a “you” problem, it is a lever you can pull to catch up.
What You Need to Use FlowView
Here is the requirement that matters most. FlowView is connected to our CRM, Treatment Flow. That is how it pulls appointment data, opportunity data, and revenue attribution accurately.
You do not have to run ads with us. You do not have to have your website with us. But at minimum, you need to be on Treatment Flow for the dashboard to work. That is what feeds it.
If you are running ads and websites through Audiology Intelligence, you get the full picture. Ad spend, campaign performance, website analytics, maps rankings, and call tracking populate automatically. Nobody on your team has to touch a Google Sheet.
For the clinics we have had on FlowView for the last thirty to sixty days, the data is already surfacing problems and gaps that never would have been caught otherwise. That is the point. Not just cleaner reporting. Better decisions, made faster, with the real numbers in front of you.
If you want help figuring out how it fits your clinic, our database marketing and automation team can walk you through the setup.
Reporting should not just tell you how much you spent. It should tell you what it produced.
Common Questions
Frequently Asked Questions
What is FlowView?
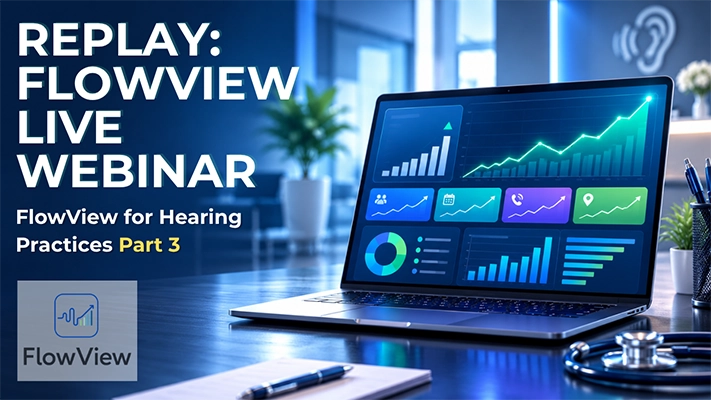
FlowView is Audiology Intelligence’s marketing dashboard, built specifically for hearing clinics. It consolidates ad spend, lead sources, appointments, treatment starts, website analytics, Google Maps rankings, and call tracking into one interface. Instead of pulling reports from Meta Ads Manager, Google Ads, Google Analytics, and your CRM separately, you see it all in one place with proper attribution.
How does FlowView attribute leads to a source?
The attribution model uses a 180 day window. If someone enters your system through a lead generation source (Meta ad, Google ad, or organic) within the last 180 days, all their subsequent activity gets credited back to that original source. If more than 180 days pass with no activity and they come back in through a new source, that new source becomes their source of record.
Do I have to use Audiology Intelligence for ads and websites to use FlowView?
No. The only requirement is that you are using Treatment Flow, our CRM system. That is what feeds the dashboard the appointment and revenue data. You can run ads elsewhere or have your website with another provider, though you will get more complete reporting the more of your stack is connected.
Can I see performance by individual campaign?
Yes. The performance page breaks down every Meta and Google campaign individually, showing spend, attributed revenue, and ROI per campaign. That is how you identify which ads to scale, which to cut, and where to shift budget.
What happens if a lead comes from organic search?
Organic leads (people who found you through a Google map pack listing or organic search result) get tracked but show NA for spend, since you are not paying per click for organic. What you are investing in for organic is SEO and content, which is reported separately in the website analytics section.
Can I set revenue or appointment goals inside FlowView?
Yes. There is a set goals tab where you can enter targets for revenue, appointments, and treatment starts. The dashboard will then track your progress toward those goals and show where you stand at any point in the period.
What is coming next in FlowView?
The next major features are AI call scoring, lead to treatment timing averages, month over month and year over year trend comparisons, and benchmarking against comparable clinics in our network. All are launching in the next couple of months.
Ready to See Your Real Numbers?
Book a short walkthrough and we will show you exactly how FlowView connects your ad spend, lead sources, and treatment revenue in one dashboard. No pressure and no sales pitch, just the numbers.